Workflow Exercise: BigQuery in Kaggle to RStudio
By Carol Addassi
September 13, 2021

Notebook Purpose
The motivation for this notebook is to practice a workflow using Kaggle, BigQuery, and RStudio while exploring survey data of vacant storefronts in August 2020 on Broadway in New York City.
For this exercise I’ll use Kaggle’s integration into BigQuery with Kaggle kernal language set to Python, and then download the .ipynb notebook file and convert to an R Markdown document in an R project containing my portfolio website using the Hugo Apéro theme with blogdown.
Why set language to Python rather than R even though I ultimately want to use it in my existing RStudio project?
My experience so far (subject of course to change) is setting Kaggle kernal language to Python rather than R works more smoothly when connecting to BigQuery.
I welcome any suggestions others have on improving this workflow!
The setup Python code is copied from Kaggle courses Intro to SQL and Advanced SQL and modified as needed.
The data analysis steps include:
- Stating a clear objective of the business task
- Describing data sources used
- Documenting cleaning and manipulation of the data
- Summarizing the analysis
- Creating visualizations that support key findings
- Offering potential next steps
Steps for Data Connection, Data Cleaning, and Data Manipulation
Scenario
The NYC Department of City Planning (DCP) is studying the Manhattan Borough President’s Office survey data of vacant storefronts in August 2020 on Broadway, from the Battery at the southern tip of Manhattan to Inwood, at the northern tip of Manhattan, highlighting business struggles in the Covid-19 pandemic. The specific business task here is to discover which community boards have the highest concentration of vacant storefronts overall and to delineate the vacancy reasons within zip codes.
Data Sources Used
For this project I uploaded a Non-Federal data.gov dataset “MBPO Broadway Storefront Vacancy Survey 2020” in survey_2020_vacant_storefronts_bway table in vacant_storefronts_bway dataset in a project I created in BigQuery in Google Cloud Platform. This Non-Federal data.gov dataset is intended for public access and use covered under these terms. I also uploaded the file to this Kaggle notebook.
Please note, after much trial and error and online searching, I could not find a successful, cost-free way to create dataframes using public datasets available in bigquery-public-data, under my own account (not part of a Kaggle tutorial exercise). I decided for this notebook task to load a (smallish) public dataset (not located in the bigquery-public-data project) from data.gov into a BigQuery project I created so I would be able to create dataframes, tables, and export csv files as needed without any BigQuery fees.
# Import the Python package to use BigQuery - attach from "Google Cloud Services" in "Add-ons" dropdown
from google.cloud import bigquery
bigquery_client = bigquery.Client(project='all-in-one-platform')
# Cloud Storage - attach from "Google Cloud Services" in "Add-ons" dropdown
from google.cloud import storage
storage_client = storage.Client(project='all-in-one-platform')
# Create a "Client" object from all-in-one-platform project I created in BigQuery
client = bigquery.Client(project='all-in-one-platform')
# Construct a reference to the "vacant_storefronts_bway" dataset I created in my all-in-one-platform project in BigQuery
dataset_ref = client.dataset('vacant_storefronts_bway', project='all-in-one-platform')
# API request - fetch the dataset
dataset = client.get_dataset(dataset_ref)
# Construct a reference to the "survey_2020_vacant_storefronts_bway" table I created from the data.gov csv file described in "Data Sources Used" above.
table_ref = dataset_ref.table('survey_2020_vacant_storefronts_bway')
# API request - fetch the table. This is the only table I uploaded in BigQuery .
table = client.get_table(table_ref)
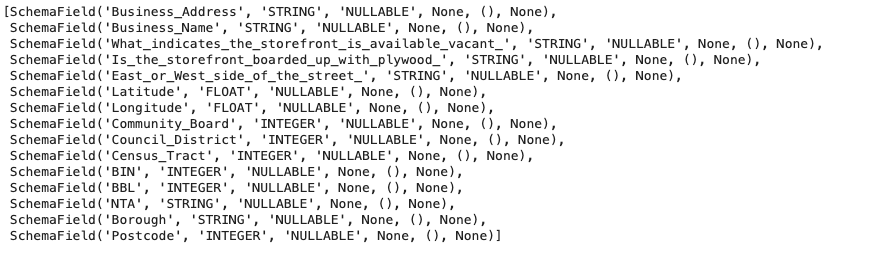
# Print information on all the columns in the "survey_2020_vacant_storefronts_bway" dataset
table.schema
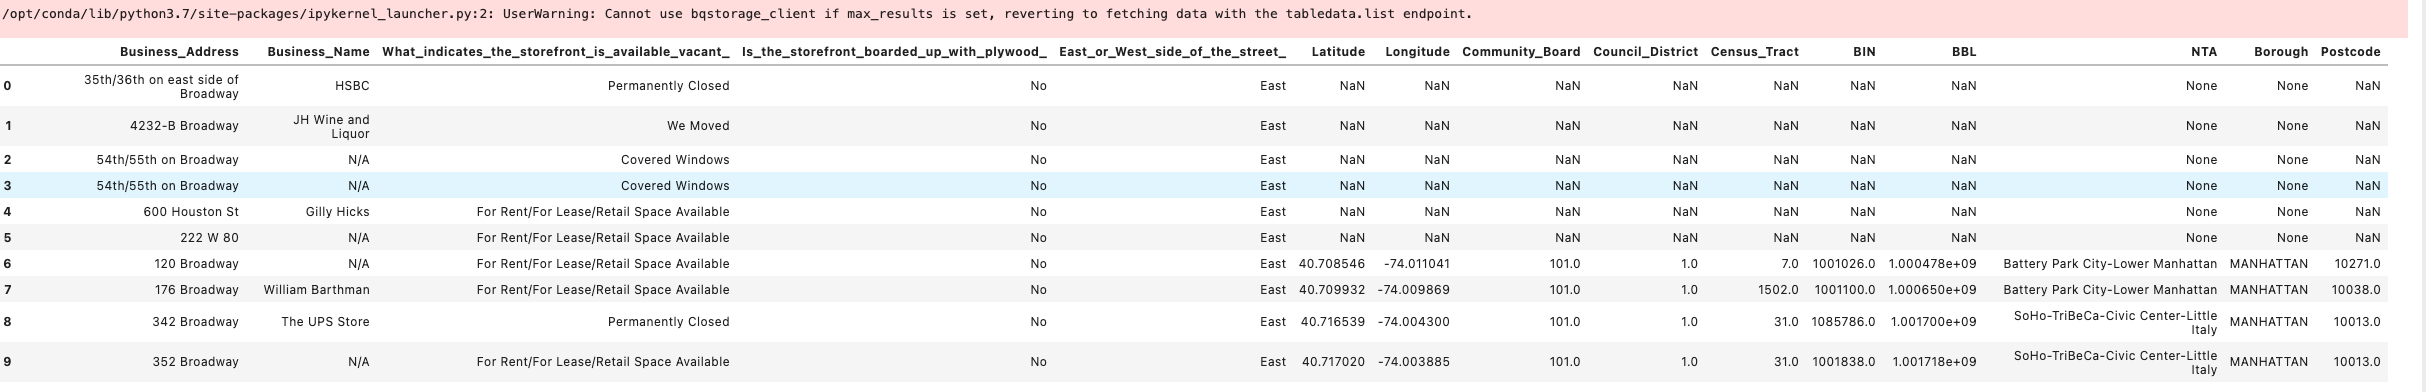
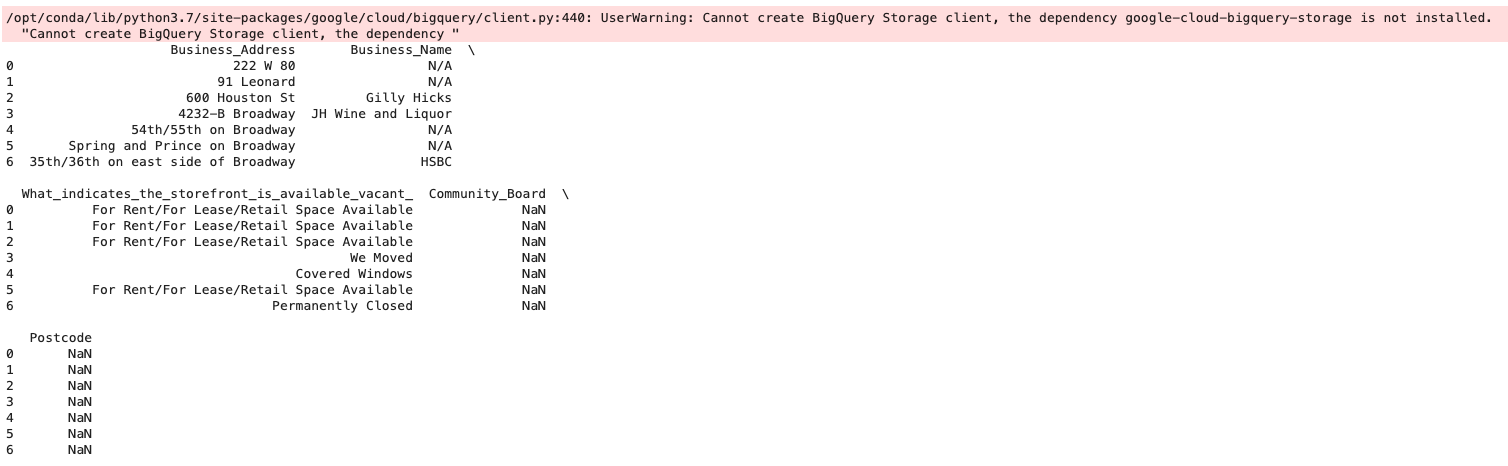
# Preview the first ten lines of the "survey_2020_vacant_storefronts_bway" table
client.list_rows(table, max_results=10).to_dataframe()
The columns I’m interested in for this task are ‘Business_Address’, ‘Business_Name’, ‘What_indicates_the_storefront_is_available_vacant_’, ‘Is_the_storefront_boarded_up_with_plywood_’, ‘East_or_West_side_of_the_street_’, ‘Latitude’, ‘Longitude’, ‘Community_Board’, ‘Council_District’, ‘Borough’, and ‘Postcode’. The survey data is all from August 2020, and there are no date fields in the data. There are no numeric fields to perform calculations on, so no cleaning is required there.
# How many rows are in the table?
num_rows_query = """
SELECT COUNT(1)
FROM   vacant_storefronts_bway.survey_2020_vacant_storefronts_bway
                                    """
# Set up the query (cancel the query if it would use too much of
# your quota.)
safe_config = bigquery.QueryJobConfig(maximum_bytes_billed=10**10)
num_rows_job = client.query(num_rows_query, job_config=safe_config)

# API request - run the query, and return a pandas DataFrame
num_rows_result = num_rows_job.to_dataframe()

# View results
print(num_rows_result)

Let’s check for duplicate records.
# Check for duplicate rows.
dup_rows_query = """
SELECT
  (SELECT COUNT(1)
  FROM (SELECT DISTINCT * FROM vacant_storefronts_bway.survey_2020_vacant_storefronts_bway)) AS distinct_rows,
  (SELECT COUNT(1)
  FROM vacant_storefronts_bway.survey_2020_vacant_storefronts_bway) as total_rows
                              """
# Set up the query (cancel the query if it would use too much of
# your quota.)
safe_config = bigquery.QueryJobConfig(maximum_bytes_billed=10**10)
dup_rows_job = client.query(dup_rows_query, job_config=safe_config)

# API request - run the query, and return a pandas DataFrame
dup_rows_result = dup_rows_job.to_dataframe()

# View results
print(dup_rows_result)

There are 8 duplicate rows. Let’s remove them.
# Remove duplicate rows.
remove_dup_rows_query = """
SELECT DISTINCT *
FROM vacant_storefronts_bway.survey_2020_vacant_storefronts_bway
                              """
# Set up the query (cancel the query if it would use too much of
# your quota.)
safe_config = bigquery.QueryJobConfig(maximum_bytes_billed=10**10)
remove_dup_rows_job = client.query(remove_dup_rows_query, job_config=safe_config)

# API request - run the query, and return a pandas DataFrame
remove_dup_rows_result = remove_dup_rows_job.to_dataframe()

# View results
print(remove_dup_rows_result)
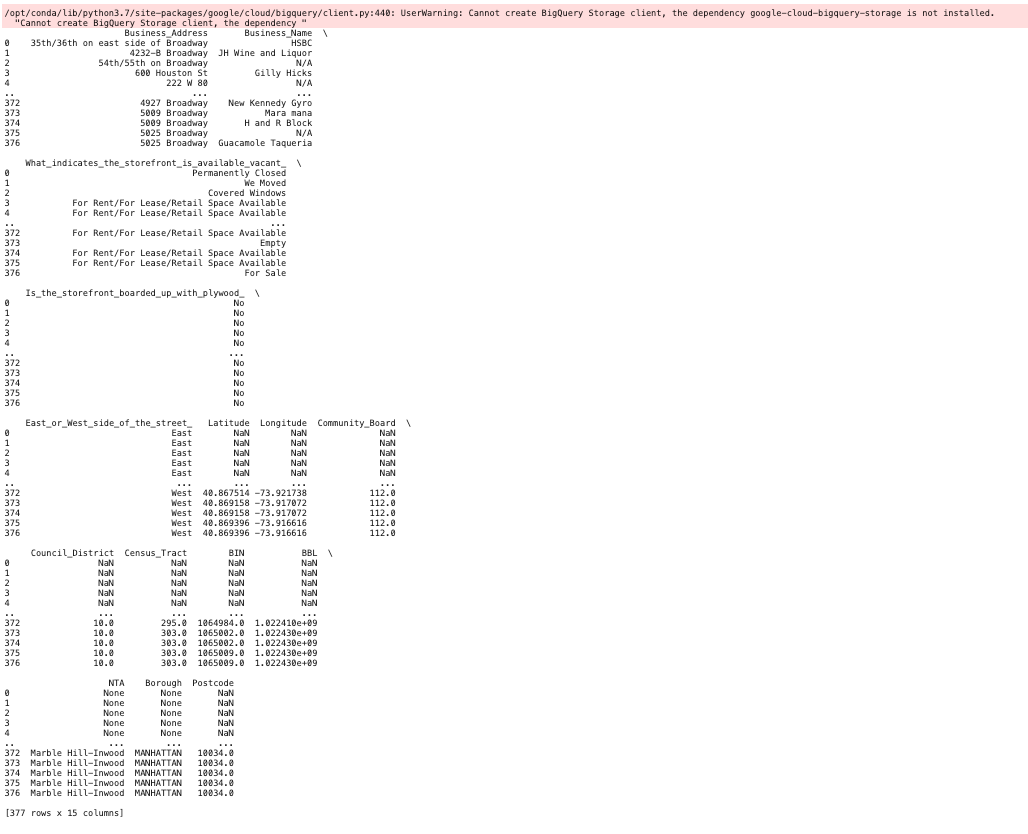
Copy the results (without the 8 duplicates) to another table containing 377 entries rather than the original 385 rows.
# Create a new table without the duplicates.
# Set table_id to the ID of the destination table.
# table_id = "all-in-one-platform.vacant_storefronts_bway.survey_2020_vacant_storefronts_clean"
# Cloud Storage - attach from "Google Cloud Services" in "Add-ons" dropdown
from google.cloud import storage
storage_client = storage.Client(project='all-in-one-platform')
# Set up destination table and overwrite table if it exists (so code can be run again without 409 Already Exists table error.)
job_config = bigquery.QueryJobConfig(destination="all-in-one-platform.vacant_storefronts_bway.survey_2020_vacant_storefronts_clean", write_disposition = 'WRITE_TRUNCATE')
#Query to create table with duplicates removed.
clean_table_query = """
SELECT DISTINCT *
FROM `vacant_storefronts_bway.survey_2020_vacant_storefronts_bway`
"""
# Start the query, passing in the extra configuration.
clean_table_job = client.query(clean_table_query, job_config=job_config)
# Wait for the job to complete.
clean_table_job.result()
# API request - run the query, and return a pandas DataFrame
clean_table_result = clean_table_job.to_dataframe()
# View results
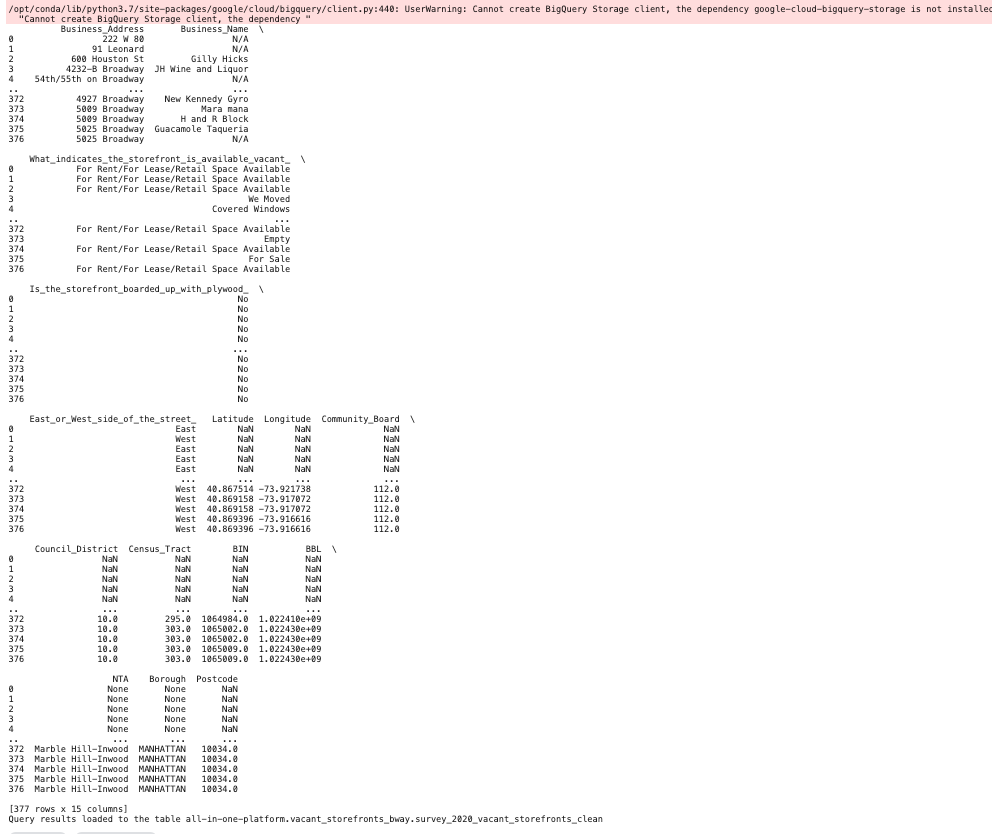
print(clean_table_result)
print("Query results loaded to the table {}".format("all-in-one-platform.vacant_storefronts_bway.survey_2020_vacant_storefronts_clean"))
# Write dataframe to csv file for later use. This shows up in the ../output/kaggle/working folder.
clean_table_result.to_csv('clean_table_result.csv', index=False)
# How many rows are in the cleaned table that contain null values in either 'Community_Board' or 'Postcode' columns?
null_rows_query = """
SELECT Business_Address, Business_Name, What_indicates_the_storefront_is_available_vacant_, Community_Board, Postcode
FROM   `all-in-one-platform.vacant_storefronts_bway.survey_2020_vacant_storefronts_clean`
WHERE Community_Board IS NULL OR Community_Board = 0 OR Postcode IS NULL  OR Postcode = 0
                                """
# Set up the query (cancel the query if it would use too much of
# your quota.)
safe_config = bigquery.QueryJobConfig(maximum_bytes_billed=10**10)
null_rows_job = client.query(null_rows_query, job_config=safe_config)

# API request - run the query, and return a pandas DataFrame
null_rows_result = null_rows_job.to_dataframe()

# View results
print(null_rows_result)
# How many rows are in the cleaned table that contain null values in 'What_indicates_the_storefront_is_available_vacant_'' column?
null_indicates_query = """
SELECT Business_Address, Business_Name, What_indicates_the_storefront_is_available_vacant_, Community_Board, Postcode
FROM   `all-in-one-platform.vacant_storefronts_bway.survey_2020_vacant_storefronts_clean`
WHERE What_indicates_the_storefront_is_available_vacant_ IS NULL
                                """
# Set up the query (cancel the query if it would use too much of
# your quota.)
safe_config = bigquery.QueryJobConfig(maximum_bytes_billed=10**10)
null_indicates_job = client.query(null_indicates_query, job_config=safe_config)

# API request - run the query, and return a pandas DataFrame
null_indicates_result = null_indicates_job.to_dataframe()

# View results
print(null_indicates_result)

There are 377 rows total with 7 rows (1.86%) that have null values in either the ‘Community_Board’ or ‘Postcode’ columns and zero null values in the ‘What_indicates_the_storefront_is_available_vacant_’ column. This is acceptable for the specific business task to leave them as nulls.
Also, this dataset is small enough that it is easy to verify these counts by filtering the data in a spreadsheet program as well as manually viewing all of the data.
Let’s discover which community boards have the highest concentration of vacant storefronts overall and to delineate the vacancy reasons within zip codes.
# Query which community boards have the highest concentration of vacant storefronts overall and group the vacancy reasons within zip codes.
num_vacancies_query = """
SELECT Community_Board, Postcode, What_indicates_the_storefront_is_available_vacant_, COUNT(Business_Address) AS total
FROM
   `all-in-one-platform.vacant_storefronts_bway.survey_2020_vacant_storefronts_clean`
    GROUP BY Community_Board, Postcode, What_indicates_the_storefront_is_available_vacant_
    ORDER BY total DESC, Community_Board
                                           """

# Set up the query (cancel the query if it would use too much of
# your quota)
safe_config = bigquery.QueryJobConfig(maximum_bytes_billed=10**10)
vacancies_query_job = client.query(num_vacancies_query, job_config=safe_config)

# API request - run the query, and return a pandas DataFrame
vacancies_result = vacancies_query_job.to_dataframe()

# View results
print(vacancies_result)
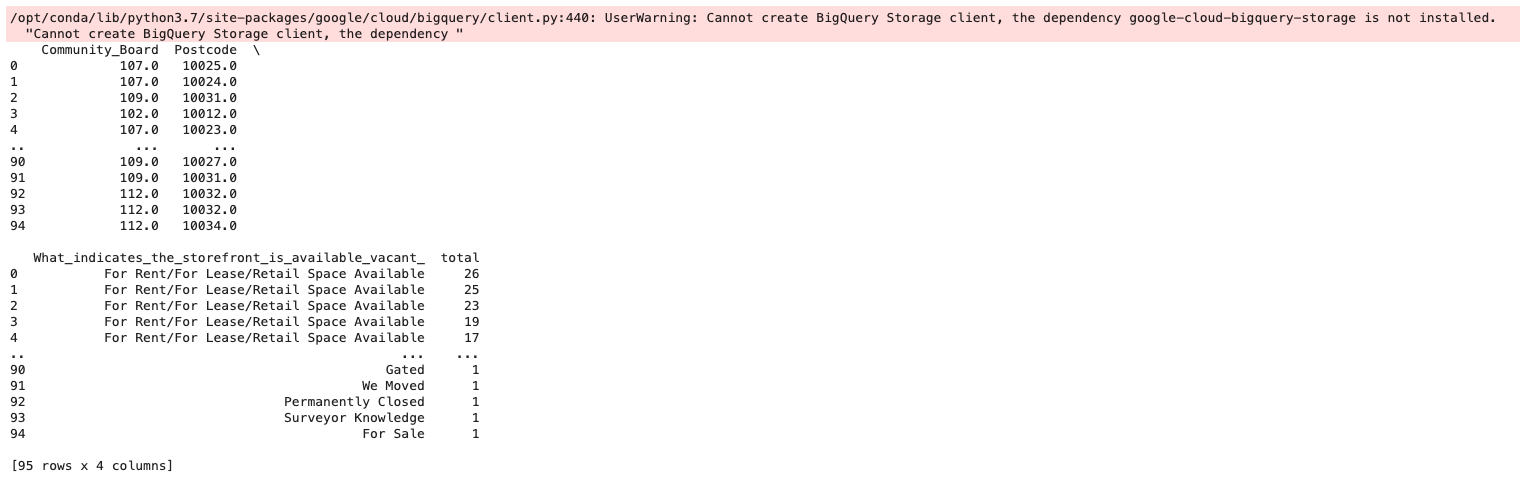
We can see zip codes 10025, 10024, 10031, 10012, and 10023 in community boards 107, 109, and 102 have the highest incidents of vacancies.
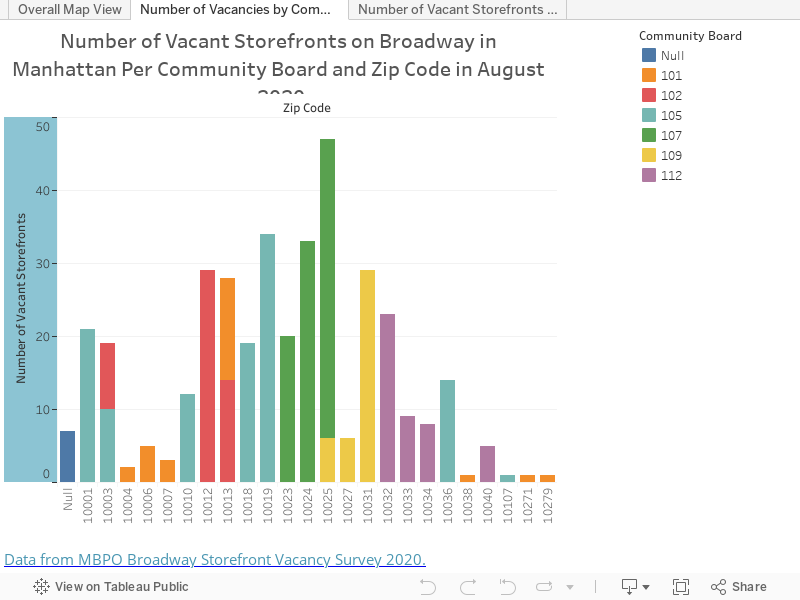
We’ll use our new, cleaned table that we wrote to a csv file above (clean_table_result.csv in …/output/kaggle/working in Tableau and create three visualizations to see this in more detail.
Next in the second tab (also shown below) we have a visualization of the number of vacant storefronts on Broadway in Manhattan per community board and zip code in August 2020.
And finally in the third tab we have a view showing the number of storefront vacancies on Broadway in Manhattan per community board in August 2020.
While it’s evident much of Broadway is experiencing large-scale shuttering of storefronts, from these graphics we can see there is an especially high concentration of issues in the Upper West Side and Harlem.
Next steps could include conducting another survey, now a year later, to see if any mitigating factors such as government pandemic funds have or have not improved the vacancy rate of storefronts on Broadway. Cross-referencing crime statistics with this data and new survey data could provide additional motivation for designing a granular neighborhood plan to increase the vacancy rate.
Loading This Notebook Into R
The immediate endpoint of this particular notebook for me is creating this portfolio piece for my website using the Hugo Apéro theme with blogdown. I completed the Google Data Analytics Certificate in August and am applying for data analyst positions.
I’m continually amazed and grateful for all of the help available online — Stack Overflow, Kaggle, RStudio Community, random posts — everywhere. I was constantly searching for tips throughout this exercise. I’d like to give a special shoutout to Han Oostdijk for posting how to get a Jupyter Notebook into an RStudio project.
Steps to load this notebook into my R project:
-
Download notebook from File/Download Notebook dropdown in Kaggle notebook.
-
Make sure these packages are installed in RStudio and then load them into my R project: library(jsonlite) library(xfun) library(bigrquery)
-
Run this line of code in my R project: nb_rmd = rmarkdown:::convert_ipynb(“my_notebook_file.ipynb”). This creates a .Rmd markdown file.
For my requirements for this exercise, I copied the contents into a .md file for a project post for my website.
Suggestions and comments are welcome for streamlining this workflow. Thank you for viewing this exercise.